Service graphs
|
|
|
|
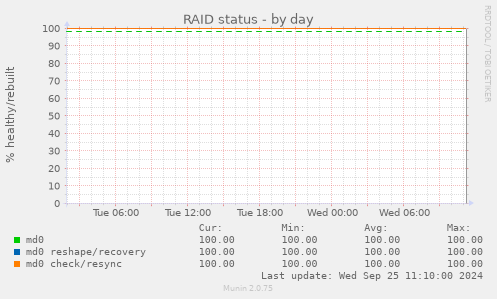
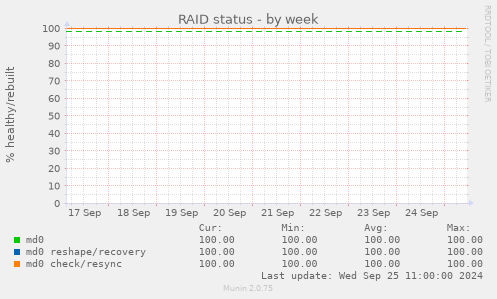
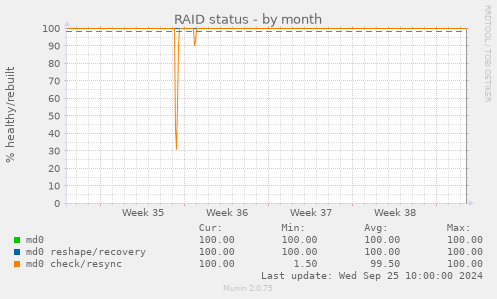
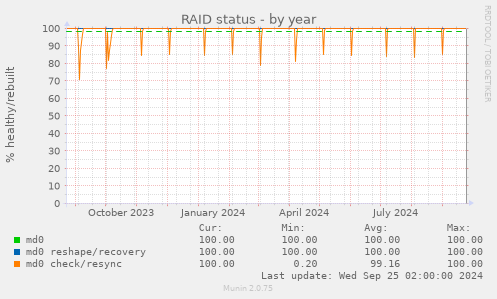
Graph Information
This graph monitors RAID disk health. Values are percentage of healthy drives in each raid group. Degraded devices are marked Critical.
| Field | Internal name | Type | Warn | Crit | Info |
|---|---|---|---|---|---|
| md0 | md0 | gauge | 98: | 95: | raid6 sdc1[5] sdb1[6] sda1[4] sdd1[7] |
| md0 reshape/recovery | md0_rebuild | gauge | 98: | 95: | idle |
| md0 check/resync | md0_check | gauge | 98: | 95: | idle |